The concepts of supply and demand in economics are the most basic principles that are effective in determining market behavior and equilibrium in the economy. These two elements play an essential and prominent role in every type of economy, from small markets to global economies. Determining the behavior of consumers and producers, the pricing of goods and services, and finally the economic balance as a result of the interaction between supply and demand, are concepts that every economist and entrepreneur should be familiar with.
In this article, the concept of supply and demand and their role in determining prices and the amount of production have been explained.
Supply and demand in plain language
As mentioned, supply in simple language in economics refers to the amount of goods or services that sellers are willing and able to sell in a certain period of time and at a certain price.
Demand in economics refers to the amount of goods or services that consumers are willing and able to buy in a certain period of time and at a certain price.
Supply and demand and their relationship with each other
Like Newton’s universal law of gravitation in physics, the law of supply and demand is the basic principle of economic theories. Supply and demand shows the relationship between the price of a product and service and the willingness of people to buy and sell it.
Supply and demand affect almost everything you buy, sell, acquire, and do. Supply and demand are among the main things that control all kinds of economic phenomena.
What is demand?
It refers to the amount of goods or services that people can buy according to the limited facilities they have. In general, the consumer consumes goods and services with the aim of obtaining utility. Demand along with supply is one of the most important influencing factors in economic actions and market mechanisms.
The demand for product “A” indicates different quantities of this product that consumers are willing to buy at different prices and in a certain period of time, of course, provided that other influencing factors and conditions are constant.
In fact, a person feels the need for a product or service, and the demand for that product continues until the consumer feels satisfied by consuming it. as a result, on the one hand, the demand factor is caused by the need to consume the product, and on the other hand, the consumer demands the product he needs until he feels satisfied with its consumption and demands it to the point of satiety regardless of the limitations.
One of the most important motivations that create demand is desirability or satisfaction, in fact, the consumer places a higher value on the product that satisfies his greatest need.
What is the utility?
The satisfaction or satisfaction that the consumer gets from consuming goods or services is called utility. The degree of satisfaction obtained from the consumption of a product or service is the same as utility. In fact, based on the criteria of satisfaction or desirability, the demand curve can be derived.
Factors affecting demand:
- The price of goods
- Consumer income
- The price of related or related goods (the price of complementary goods or the price of substitute goods)
- Expected price
- Number of potential applicants
- time factor
- Weather conditions
- Advertising
- Consumer age
- Gender of the consumer
- Limiting the existence of certain goods or services
- Consumer age
- Gender of the consumer
- fashion
- Consumer taste
- Color, taste and structure of the product
demand curve:
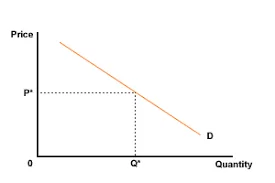
The demand curve is actually the geometric location of the various combinations available in the market for consumers. By using the demand curve, we can better examine the effect of changing factors affecting demand. Also, the demand curve shows us how much a person is willing to consume at each price. In general, in the demand function, “Quality” is an endogenous factor and “Price” and other factors affecting demand are exogenous.
Therefore, in the demand curve, the vertical axis should represent quantity and the horizontal axis should represent price, but generally, in demand graphs, the vertical axis represents “Price” and the horizontal axis represents “Quality”. As a result, most observed demand curves are actually inverse demand curves.
What is supply?
“Supply” is a part of manufactured products or services that are offered for sale by manufacturers. In general, it is possible that part of the manufactured products will not be kept in the warehouse and supplied. Supply, like demand, is one of the most important economic forces in the market.
The supply of a given commodity indicates how much of it the producers will sell at any given price (if other conditions remain constant).
Factors affecting supply:
- The price of goods
- The technology used in the production of that product
- The price of the production factors of that product
- The cost of producing goods
- supply of related goods (substitute or complementary goods)
- Expected price
- Atmospheric and climatic conditions
- Number of suppliers
- Effect of tax or subsidy
- Government policies
- Discovery of new resources
- time
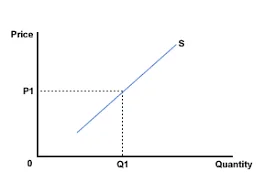
Supply curve
A supply curve is a geometric graph of the supply function. The supply curve represents the maximum quantity that producers are willing to sell at a given price.
What is equilibrium in the economy?
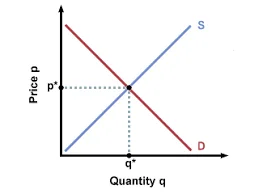
At the point where the supply and demand curves meet, we say that we have reached equilibrium. “Equilibrium price” is the price where the desires of consumers and the desires of producers come to an agreement.
That is, the quantity of the product that consumers want to buy (quantity demanded) is equal to the quantity that producers intend to sell (quantity supplied). This quantity desired by the supplier and the demander is called the Equilibrium Quantity.
At any other price, the quantity demanded will not equal the quantity supplied. Therefore, the market will not be in equilibrium at that price. If you only have supply and demand quantities and do not have access to supply and demand graphs, we have an equilibrium when the quantity of goods demanded and the quantity of goods supplied are equal.
That is, in fact, you can find the equilibrium price and quantity in this way. It is enough to solve the supply and demand functions like equations of two unknowns and find the equilibrium quantity and equilibrium price. Note that equilibrium can be of different types and can be stable or unstable.
What is elasticity in supply and demand?
As we mentioned above, a higher price will bring a lower demand, but to know how much the demand will decrease, you need to know the elasticity. Elasticity, in fact, measures the changes of one variable against another variable.
Supply and demand both represent the relationship between price and quantity, and elasticity helps us better understand this relationship. Note that elasticity is actually a measure of change from one variable to another. That is, elasticity can be used for relationships beyond the relationship between price and demand.
Price elasticity of demand
It shows the percentage change in the quantity demanded of a good or service divided by the percentage change in price. In fact, this elasticity measures the response of quantity demanded to changes in price.
Price elasticity of supply
In fact, it represents the percentage change in the quantity supplied divided by the percentage change in price. Price elasticity of supply tells us the responsiveness of quantity supplied to changes in price.
What is income elasticity?
As stated above, all types of goods in the economy can be classified into luxury, Giffen, basic, essential and normal categories depending on the change in consumer behavior towards income changes. This responsiveness to change in income can also be measured by income elasticity.
Whether the final answer is positive or negative provides useful information about the consumer’s opinion about the product. A normal good has a negative income elasticity. If the percentage change in income is positive, the percentage change in quantity will also be positive and vice versa. Postal goods have a negative income elasticity, that is, if the percentage of changes in income is positive, the percentage of changes in value will be negative and vice versa.
Classification of types of stretching according to amount:
Stretching can be divided into 3 significant categories below:
- Perfectly Elastic: Perfectly elastic demand is demand where the elasticity number is greater than 1. It means that responding to price changes is very high.
- Perfectly inelastic: Elasticities less than 1 indicate less responsiveness to price changes and indicate inelastic demand.
- Unit elasticity: (Unit Elasticity) shows proportional response of demand or supply.
Detecting the size of the tension in the chart:
If we want to calculate the elasticity for any point in the demand curve, we can divide the demand curve into 3 elastic parts, unit elasticity and no elasticity, according to the picture below. That is, the effectiveness of the price change depends on the location in the chart.
What is aInferior Good?
(Inferior Good) is a product that the consumer’s demand for its consumption decreases with an increase in income. Often, inferior goods are cheap substitutes for “normal goods” or “necessary goods” such as food. For example, as a person’s income decreases, it is possible for him to buy inferior goods that are priced lower than normal goods. As wages rise again, it is likely that a person will consume normal goods instead of inferior goods.
In fact, this phrase does not indicate the quality of the product, but rather its price and hypothetical value. It is possible that the value of post goods is lower than normal goods with the same conditions, but in other cases these goods are of equal quality.
In fact, in some cases, the normal product and the identical post product are composed of the same basic ingredients and the only difference between them is the way they are packaged and their price. In fact, with the reduction of “disposable income”, it is more possible for the person to consume goods with a lower price.

What is a Giffen product?
As stated earlier, according to the law of demand, the price and quantity of the demanded product have an inverse relationship. That is, as the price increases, the amount of demand for the product will decrease and vice versa. A Giffen good is a good that, with an increase in price, people will demand more of it.
In fact, a Giffen good is a type of inferior good with no substitute. As a result, the substitution effect does not apply with price changes. Examples of Giffen goods include bread. As the price of bread increases, poor people consume more of it, which is called the Giffen Paradox.
Examining the effect of price and quantity with elasticity:
Suppose the owner of a coffee shop wants to increase his prices. The owner of the coffee shop should consider whether the income will increase or decrease when deciding to increase the price.
- By increasing the price, you increase the revenue per units sold (the price effect).
- As the price increases, you will sell fewer units (quantitative effect).
These two things work against each other. In order to determine which one prevails over the other, we must consider the tension. When our point is elastic, the percentage change in quantity will be greater than the percentage change in price. That is, if we increase the price, the quantity effect will overcome the price effect and the income will eventually decrease.
When we are at the inelastic point, the percentage change in quantity is less than the percentage change in price. That is, with the price increase, the price effect will be stronger than the quantity effect and the income will increase as a result.
The first thing to keep in mind is that at a point with unit elasticity, revenue is maximized. If you are in a stretchable point, the quantity effect will prevail over the price effect. That is, by reducing the prices, the income obtained from the sale of more units will be more prominent than the lost income due to the price reduction.
If you are at an inelastic point, the price effect is stronger than the quantity effect. That is, by increasing the prices, the income obtained from higher prices will overcome the lost income due to the sale of fewer units of goods.
You noticed that wherever income was mentioned, we also paid attention to expenses. Because every thousand tomans earned by the coffee shop represents a thousand tomans spent by the consumer. Therefore, if corporate income is increasing, consumer spending is also increasing.
What are the factors influencing the tension?
demand:
- Availability of substitute goods
- The need for goods
- income
Supply:
- Availability of resources
- Creativity in technology
- barriers to entry
- time
Final words
Supply and demand is one of the most basic concepts of economy and an important pillar of market economy. Demand refers to the quantity of a product or service that is desired by buyers. Quantity demanded is the amount of a product or service that people are willing to buy at a certain price. The relationship between price and quantity demanded is known as the demand relationship.
Supply indicates the amount of goods or services available in the market. The quantity supplied is the amount of a product or service that a producer is willing to supply at a given price. Therefore, price – one of the most important economic signals – is a reflection of supply and demand.
Meran Group content production team